 24.pprof
# 01.pprof
# 1、pprof作用
- pprof 是一个
性能分析工具,它可以帮助开发人员识别和解决应用程序中的性能瓶颈 - 它可以
分析应用程序的CPU利用率、内存使用情况、线程堆栈等信息,并生成可视化报告
- 获取测试项目
git clone https://gitee.com/xiaonqedu/go-pprof-practice.git
cd go-pprof-practice
1
2
2
# 2、使用 pprof
- 编译并运行项目
打开页面:http://localhost:6060/debug/pprof/
go build
./go-pprof-practice
1
2
2
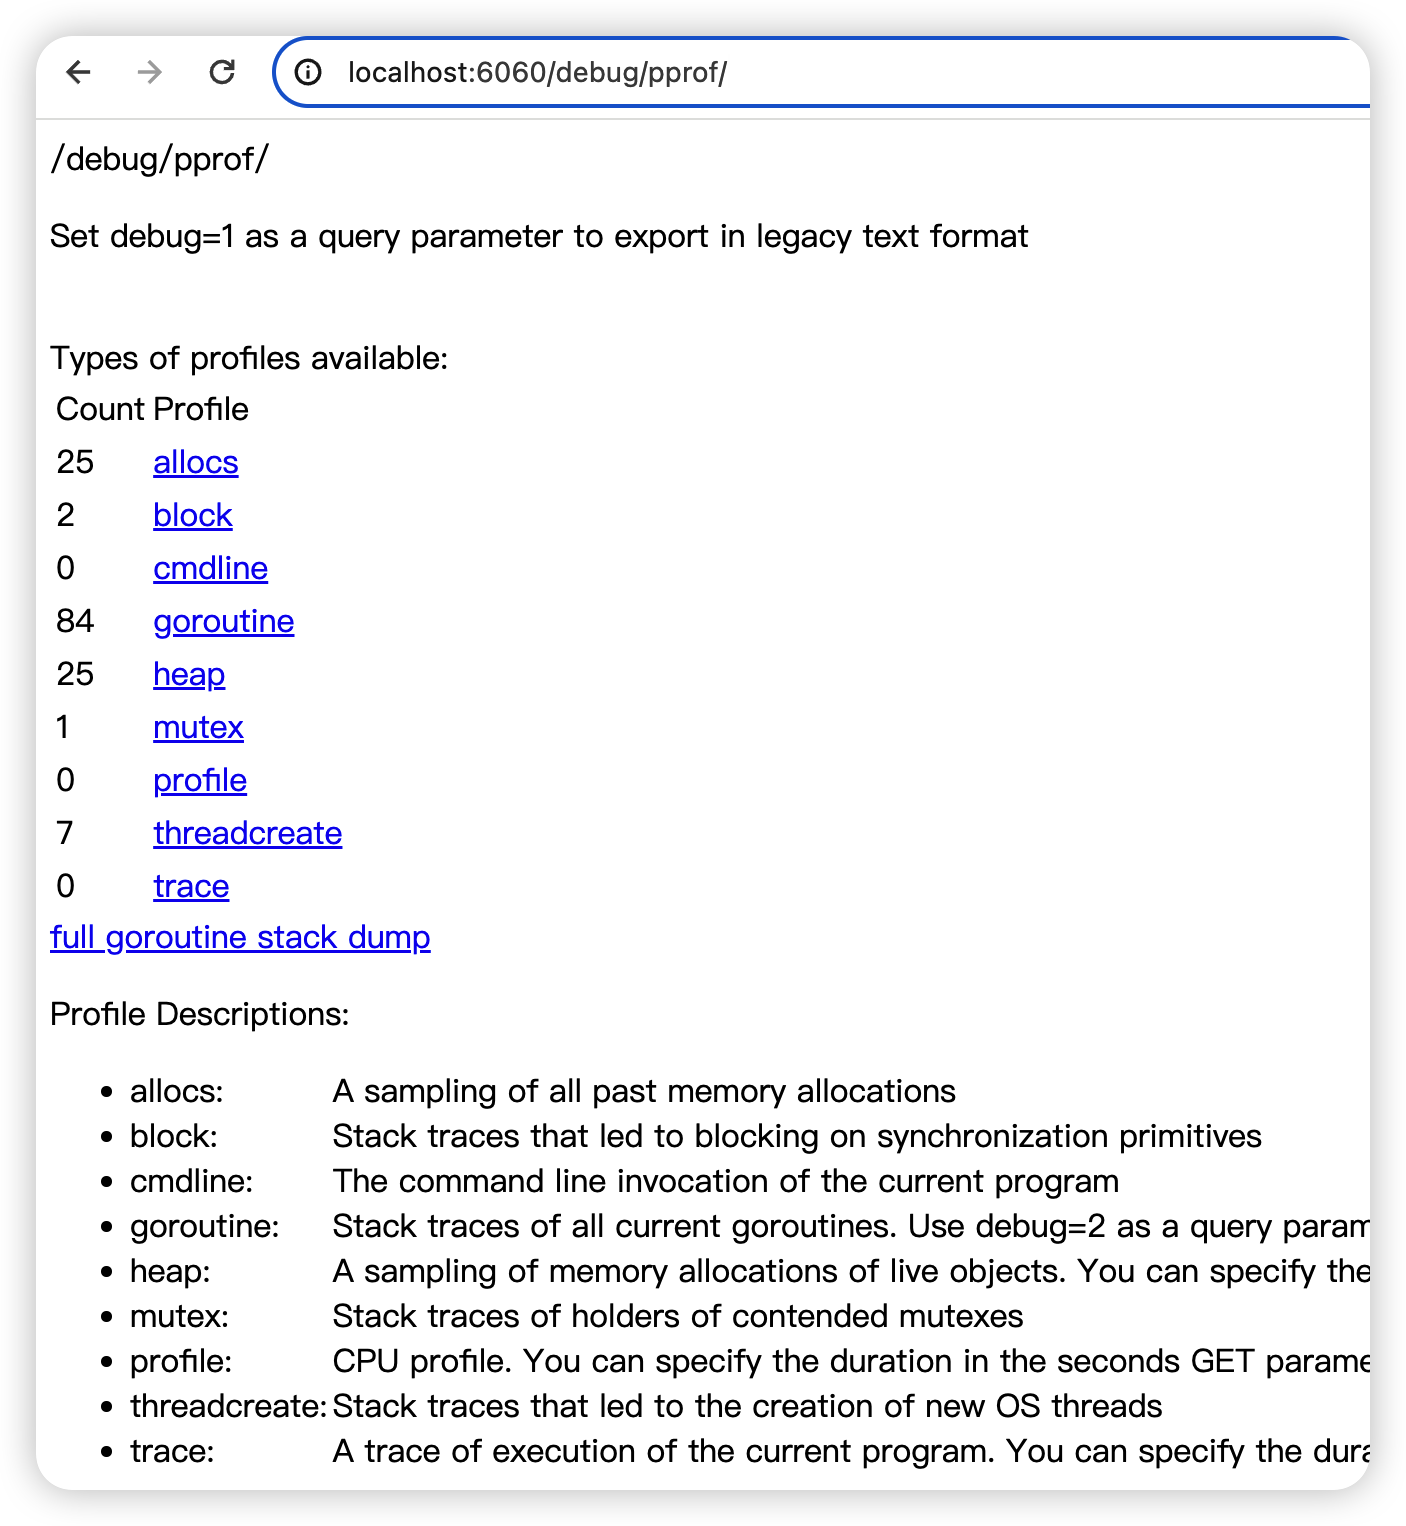
- 页面上展示了可用的程序运行采样数据,分别有
| 类型 | 描述 | 备注 |
|---|---|---|
| allocs | 内存分配情况的采样信息 | 可以用浏览器打开,但可读性不高 |
| blocks | 阻塞操作情况的采样信息 | 可以用浏览器打开,但可读性不高 |
| cmdline | 显示程序启动命令及参数 | 可以用浏览器打开,这里会显示 ./go-pprof-practice |
| goroutine | 当前所有协程的堆栈信息 | 可以用浏览器打开,但可读性不高 |
| heap | 堆上内存使用情况的采样信息 | 可以用浏览器打开,但可读性不高 |
| mutex | 锁争用情况的采样信息 | 可以用浏览器打开,但可读性不高 |
| profile | CPU 占用情况的采样信息 | 浏览器打开会下载文件 |
| threadcreate | 系统线程创建情况的采样信息 | 可以用浏览器打开,但可读性不高 |
| trace | 程序运行跟踪信息 | 浏览器打开会下载文件,本文不涉及,可另行参阅《深入浅出 Go trace》 (opens new window) |
# 3、排查 CPU 占用过高
- go tool pprof http://localhost:6060/debug/pprof/profile
# 1、top
top 命令查看CPU占用情况- 很明显是 github.com/wolfogre/go-pprof-practice/animal/felidae/tiger.(*Tiger).Eat 占用cpu时间非常长
tom.xiao@MBC02GG0L8MD6V ~ %  go tool pprof http://localhost:6060/debug/pprof/profile
(pprof) top

			# 注:下面指的时间都是函数占用CPU的时间
      # flat: 特定函数内部花费的时间(不包括在其子函数中花费的时间)
      # Flat%: 该函数自身的执行时间占比(在整个程序执行时间中)
      # Sum%: 该函数及其所有子函数执行时间占总执行时间的百分比
      # Cum: 函数及其子函数中累积花费的总时间
      # Cum%: 该函数及其子函数的执行时间占比(在整个程序执行时间中)
      flat  flat%   sum%        cum   cum%
   11380ms 98.61% 98.61%    11520ms 99.83%  github.com/wolfogre/go-pprof-practice/animal/felidae/tiger.(*Tiger).Eat
     140ms  1.21% 99.83%      140ms  1.21%  runtime.asyncPreempt
         0     0% 99.83%    11530ms 99.91%  github.com/wolfogre/go-pprof-practice/animal/felidae/tiger.(*Tiger).Live
         0     0% 99.83%    11540ms   100%  main.main
         0     0% 99.83%    11540ms   100%  runtime.main
1
2
3
4
5
6
7
8
9
10
11
12
13
14
15
2
3
4
5
6
7
8
9
10
11
12
13
14
15
# 2、list
list Eat,查看问题具体在代码的哪一个位置- 可以看到,那个一百亿次空循环占用了大量 CPU 时间,至此,问题定位成功
(pprof) list Eat
Total: 11.54s
ROUTINE ======================== github.com/wolfogre/go-pprof-practice/animal/felidae/tiger.(*Tiger).Eat in /Users/tom.xiao/tmpDir/go-pprof-practice/animal/felidae/tiger/tiger.go
    11.38s     11.52s (flat, cum) 99.83% of Total
         .          .     21:func (t *Tiger) Eat() {
         .          .     22:	log.Println(t.Name(), "eat")
         .          .     23:	loop := 10000000000
    11.38s     11.52s     24:	for i := 0; i < loop; i++ {
         .          .     25:		// do nothing
         .          .     26:	}
         .          .     27:}
         .          .     28:
         .          .     29:func (t *Tiger) Drink() {
1
2
3
4
5
6
7
8
9
10
11
12
13
2
3
4
5
6
7
8
9
10
11
12
13
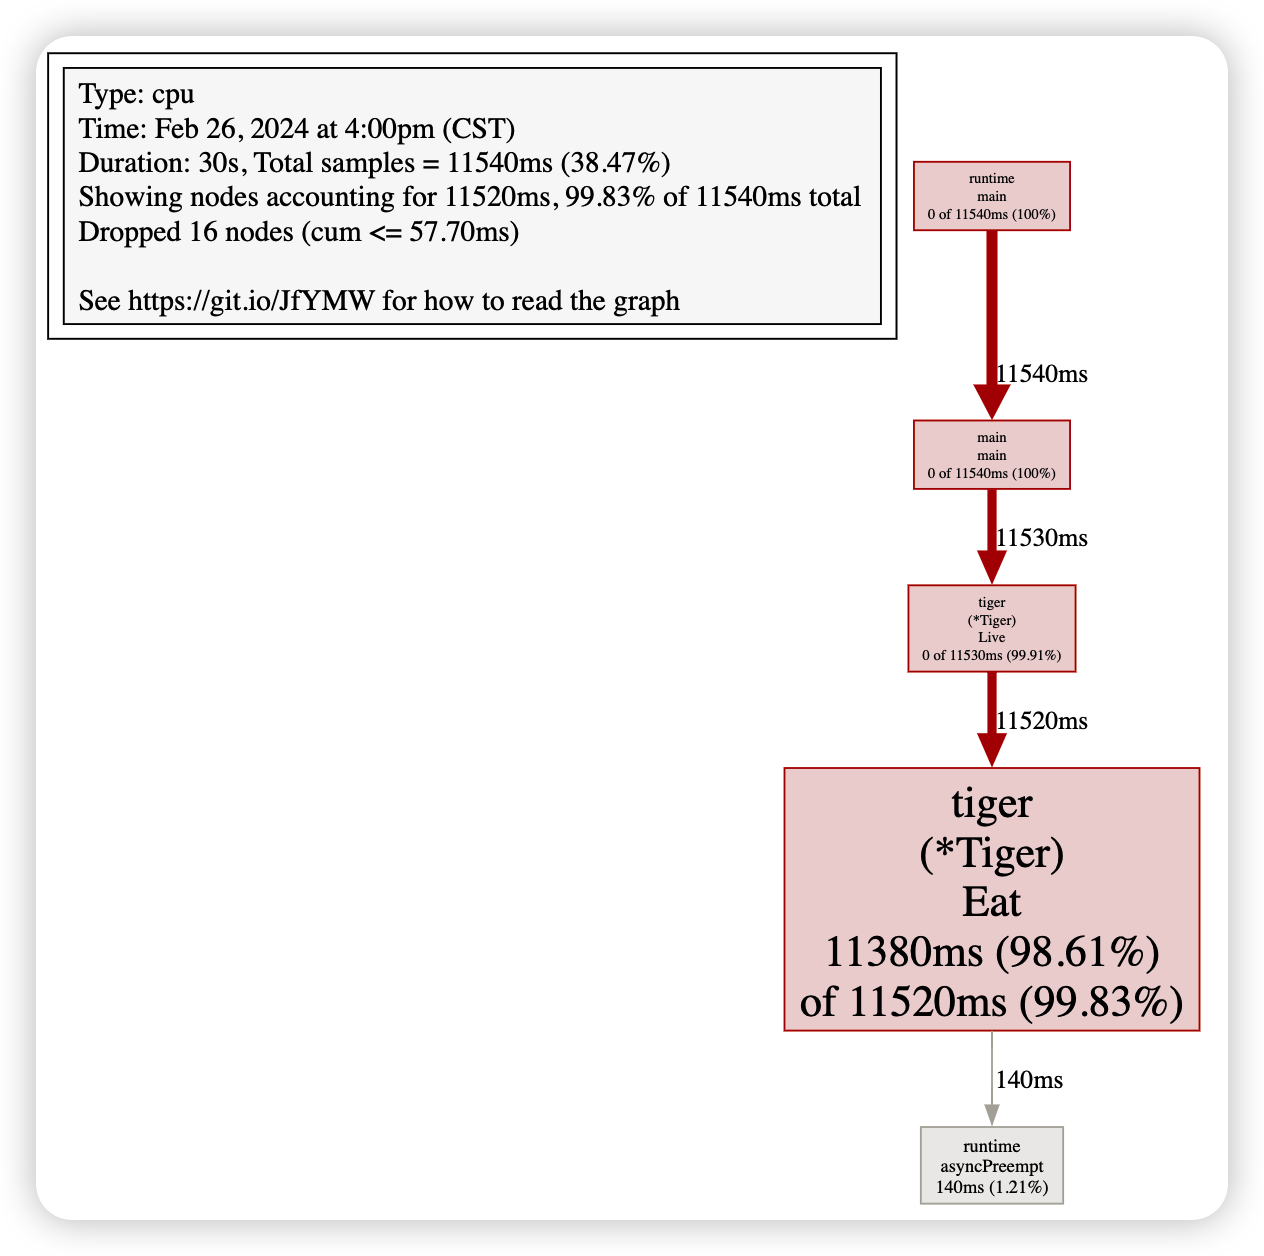
# 3、web
图形化显示调用栈信息- 图中,
tiger.(*Tiger).Eat函数的框特别大,箭头特别粗,pprof 生怕你不知道这个函数的 CPU 占用很高
- 图中,
# 事先在机器上安装 `graphviz`
brew install graphviz
# 继续在上文的交互式终端里输入 web (实际行为是产生一个 .svg 文件如下图,自动使用浏览器打开)
web
1
2
3
4
2
3
4
# 4、排查内存占用过高
- go tool pprof http://localhost:6060/debug/pprof/heap
# 1、top
top 命令查看内存占用情况- 很明显是 github.com/wolfogre/go-pprof-practice/animal/felidae/tiger.(*Tiger).Eat 占用cpu时间非常长
tom.xiao@MBC02GG0L8MD6V ~ % go tool pprof http://localhost:6060/debug/pprof/heap
(pprof) top
			# 注:下面指的时间都是函数占用内存的情况
      # flat: 特定函数占用内存数量
      # Flat%: 该函数自身使用内存占比
      # Sum%: 该函数及其所有子函数使用内存的百分比
      # Cum: 函数及其子函数中内侧使用量
      # Cum%: 该函数及其子函数使用内存占比
Showing nodes accounting for 2.41GB, 100% of 2.41GB total
      flat  flat%   sum%        cum   cum%
    1.20GB 50.00% 50.00%     1.20GB 50.00%  github.com/wolfogre/go-pprof-practice/animal/muridae/mouse.(*Mouse).Pee.func1
    1.20GB 50.00%   100%     1.20GB 50.00%  github.com/wolfogre/go-pprof-practice/animal/muridae/mouse.(*Mouse).Steal
         0     0%   100%     1.20GB 50.00%  github.com/wolfogre/go-pprof-practice/animal/muridae/mouse.(*Mouse).Live
         0     0%   100%     1.20GB 50.00%  main.main
         0     0%   100%     1.20GB 50.00%  runtime.main
1
2
3
4
5
6
7
8
9
10
11
12
13
14
15
2
3
4
5
6
7
8
9
10
11
12
13
14
15
# 2、list
list Steal,查看问题具体在代码的哪一个位置- 这里有个循环会一直向 m.buffer 里追加长度为 1 MiB 的数组,直到总容量到达 1 GiB 为止,且一直不释放这些内存
(pprof) list Steal
Total: 2.41GB
ROUTINE ======================== github.com/wolfogre/go-pprof-practice/animal/muridae/mouse.(*Mouse).Steal in /Users/tom.xiao/tmpDir/go-pprof-practice/animal/muridae/mouse/mouse.go
    1.20GB     1.20GB (flat, cum) 50.00% of Total
         .          .     56:func (m *Mouse) Steal() {
         .          .     57:	log.Println(m.Name(), "steal")
         .          .     58:	max := constant.Gi
         .          .     59:	for len(m.buffer)*constant.Mi < max {
    1.20GB     1.20GB     60:		m.buffer = append(m.buffer, [constant.Mi]byte{})
         .          .     61:	}
         .          .     62:}
1
2
3
4
5
6
7
8
9
10
11
2
3
4
5
6
7
8
9
10
11
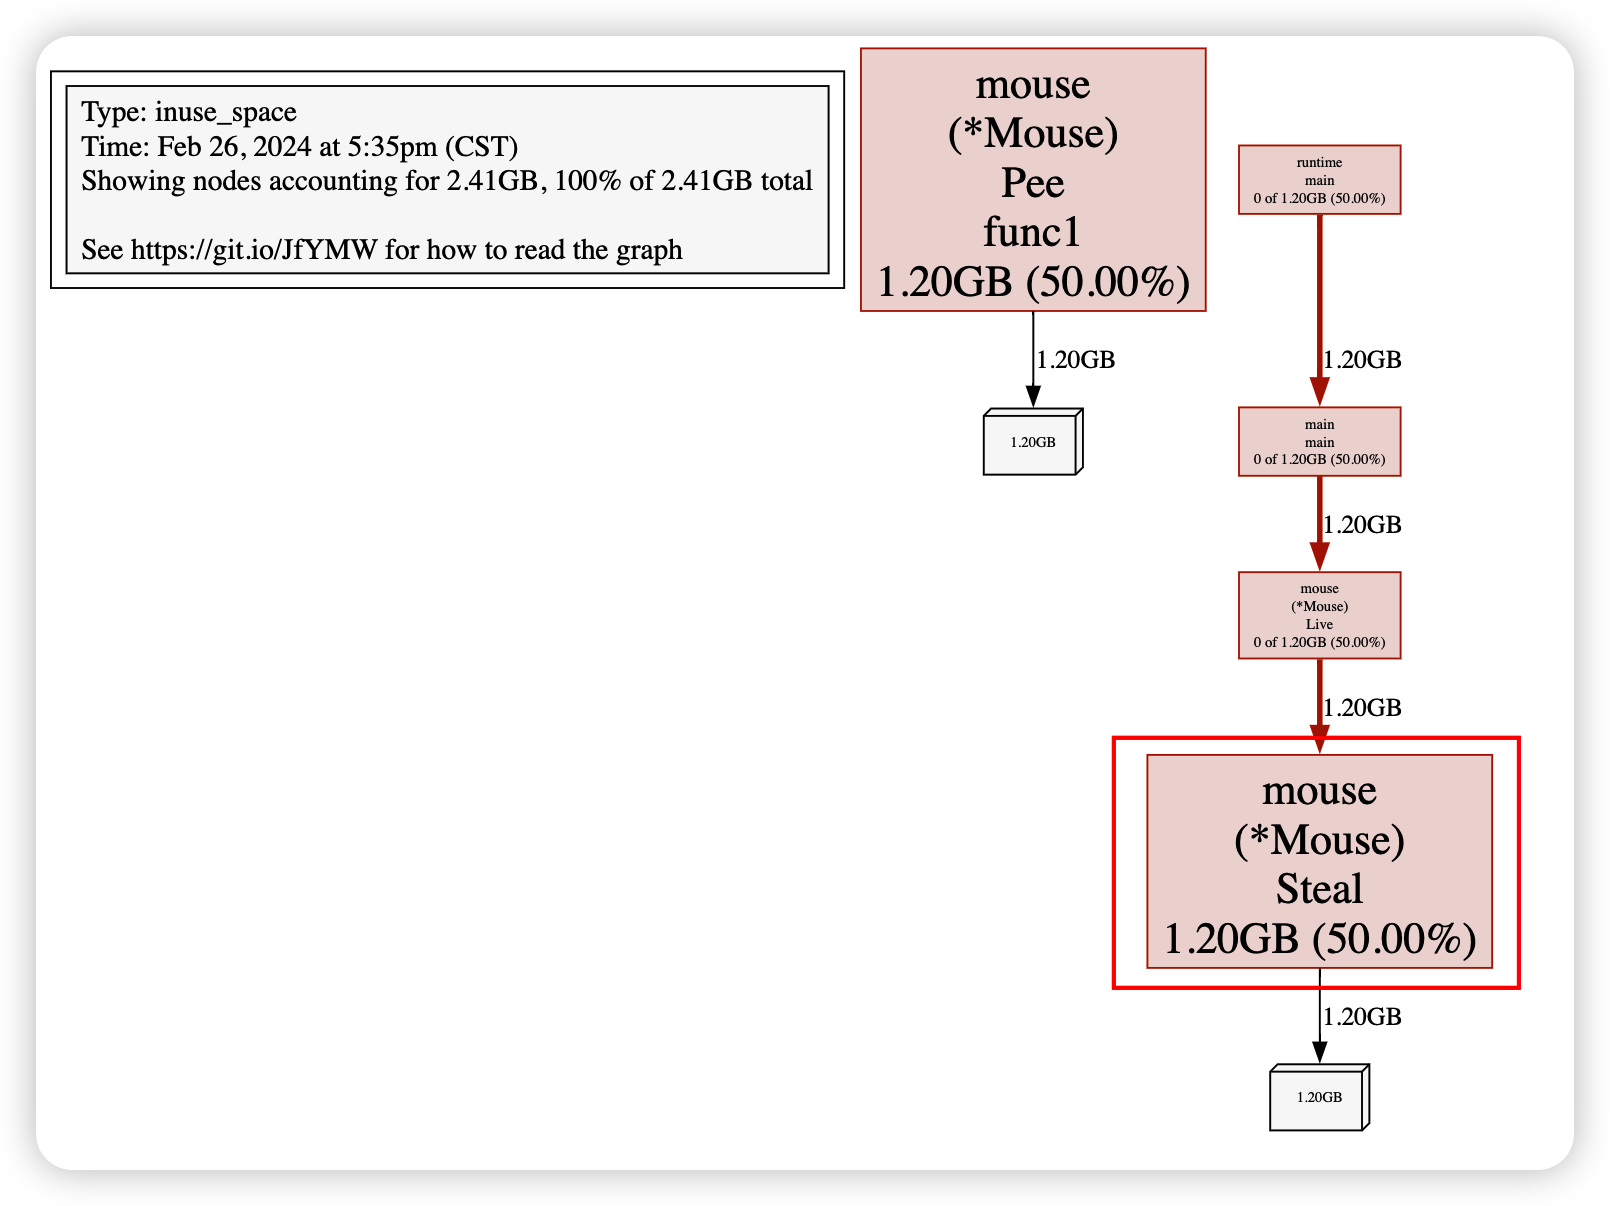
# 3、web
图形化显示调用栈信息- mouse.(*Mouse).Steal 使用了大量内存不释放
# 5、频繁内存回收
- go tool pprof http://localhost:6060/debug/pprof/allocs
# 1、top
top 命令查看GC清理情况
tom.xiao@MBC02GG0L8MD6V ~ % go tool pprof http://localhost:6060/debug/pprof/allocs
(pprof) top
      # flat: 一个函数内部分配的内存大小
      # Flat%: 特定函数占用的百分比
      # Sum%: 特定函数及其调用函数中性能或内存分配的总百分比
      # Cum: 函数及其调用函数中的累积性能或内存分配
      # Cum%: 特定函数及其调用函数中性能或内存分配的总累积百分比
      flat  flat%   sum%        cum   cum%
   24.88GB 78.39% 78.39%    24.88GB 78.39%  github.com/wolfogre/go-pprof-practice/animal/canidae/dog.(*Dog).Run
    3.83GB 12.06% 90.46%     3.83GB 12.06%  github.com/wolfogre/go-pprof-practice/animal/muridae/mouse.(*Mouse).Pee.func1
    3.01GB  9.50%   100%     3.02GB  9.50%  github.com/wolfogre/go-pprof-practice/animal/muridae/mouse.(*Mouse).Steal
         0     0%   100%    24.88GB 78.40%  github.com/wolfogre/go-pprof-practice/animal/canidae/dog.(*Dog).Live
         0     0%   100%     3.02GB  9.50%  github.com/wolfogre/go-pprof-practice/animal/muridae/mouse.(*Mouse).Live
         0     0%   100%    27.90GB 87.92%  main.main
1
2
3
4
5
6
7
8
9
10
11
12
13
14
15
2
3
4
5
6
7
8
9
10
11
12
13
14
15
# 2、list
list Run,查看问题具体在代码的哪一个位置(*Dog).Run会进行无意义的内存申请,而这个函数又会被频繁调用,这才导致程序不停地进行 GC
(pprof) list Run
Total: 31.73GB
ROUTINE ======================== github.com/wolfogre/go-pprof-practice/animal/canidae/dog.(*Dog).Run in /Users/tom.xiao/tmpDir/go-pprof-practice/animal/canidae/dog/dog.go
   24.88GB    24.88GB (flat, cum) 78.39% of Total
         .          .     41:func (d *Dog) Run() {
         .          .     42:	log.Println(d.Name(), "run")
   24.88GB    24.88GB     43:	_ = make([]byte, 16*constant.Mi)
         .          .     44:}
         .          .     45:
         .          .     46:func (d *Dog) Howl() {
         .          .     47:	log.Println(d.Name(), "howl")
         .          .     48:}
1
2
3
4
5
6
7
8
9
10
11
12
2
3
4
5
6
7
8
9
10
11
12
# 6、协程泄露
- go tool pprof http://localhost:6060/debug/pprof/goroutine
# 1、top
top 命令查看goroutine泄漏情况
tom.xiao@MBC02GG0L8MD6V ~ % go tool pprof http://localhost:6060/debug/pprof/goroutine

(pprof) top
      flat  flat%   sum%        cum   cum%
        58 96.67% 96.67%         58 96.67%  runtime.gopark
         1  1.67% 98.33%          1  1.67%  runtime.goroutineProfileWithLabels
         0     0% 98.33%         50 83.33%  github.com/wolfogre/go-pprof-practice/animal/canidae/wolf.(*Wolf).Drink.func1
         0     0% 98.33%          6 10.00%  github.com/wolfogre/go-pprof-practice/animal/muridae/mouse.(*Mouse).Pee.func1
         0     0% 98.33%          1  1.67%  internal/poll.(*FD).Accept
         0     0% 98.33%          1  1.67%  internal/poll.(*pollDesc).wait
         0     0% 98.33%          1  1.67%  internal/poll.(*pollDesc).waitRead (inline)
         0     0% 98.33%          1  1.67%  internal/poll.runtime_pollWait
         0     0% 98.33%          1  1.67%  main.main
1
2
3
4
5
6
7
8
9
10
11
12
13
14
2
3
4
5
6
7
8
9
10
11
12
13
14
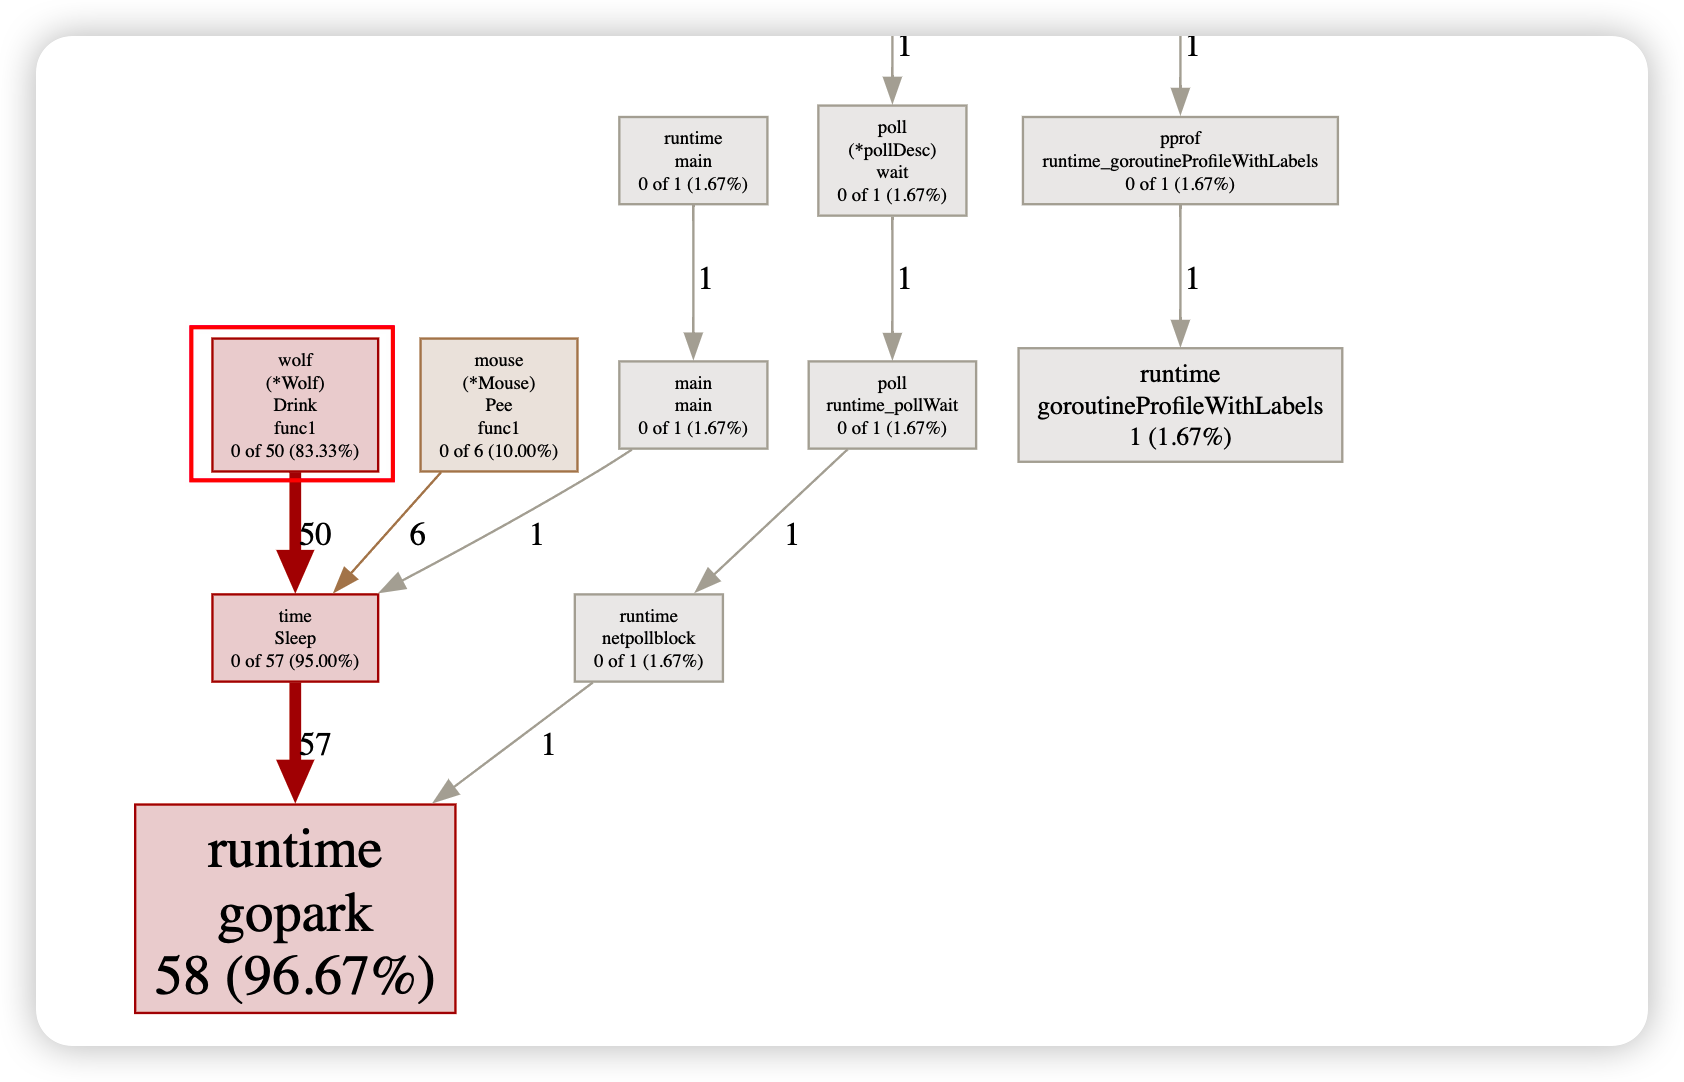
# 2、list
Drink在不停地创建没有实际作用的协程- Drink 函数每次会释放 10 个协程出去,每个协程会睡眠 30 秒再退出
- 而 Drink 函数又会被反复调用,这才导致大量协程泄露
(pprof) list Drink
Total: 60
ROUTINE ======================== github.com/wolfogre/go-pprof-practice/animal/canidae/wolf.(*Wolf).Drink.func1 in /Users/tom.xiao/tmpDir/go-pprof-practice/animal/canidae/wolf/wolf.go
         0         50 (flat, cum) 83.33% of Total
         .          .     33:		go func() {
         .         50     34:			time.Sleep(30 * time.Second)
         .          .     35:		}()
         .          .     36:	}
         .          .     37:}
         .          .     38:
         .          .     39:func (w *Wolf) Shit() {
1
2
3
4
5
6
7
8
9
10
11
2
3
4
5
6
7
8
9
10
11
# 3、web
# 7、排查锁的争用
- 在程序中,除了锁的争用会导致阻塞之外,很多逻辑都会导致阻塞
- go tool pprof http://localhost:6060/debug/pprof/block
# 1、top
tom.xiao@MBC02GG0L8MD6V ~ % go tool pprof http://localhost:6060/debug/pprof/block

(pprof) top
      flat  flat%   sum%        cum   cum%
  1866.51s 49.61% 49.61%   1866.51s 49.61%  runtime.chanrecv1
  1866.14s 49.60% 99.20%   1866.14s 49.60%  sync.(*Mutex).Lock (inline)
       30s   0.8%   100%        30s   0.8%  runtime.selectgo
         0     0%   100%   1866.14s 49.60%  github.com/wolfogre/go-pprof-practice/animal/canidae/wolf.(*Wolf).Howl
         0     0%   100%   1866.14s 49.60%  github.com/wolfogre/go-pprof-practice/animal/canidae/wolf.(*Wolf).Live
         0     0%   100%   1866.51s 49.61%  github.com/wolfogre/go-pprof-practice/animal/felidae/cat.(*Cat).Live
         0     0%   100%   1866.51s 49.61%  github.com/wolfogre/go-pprof-practice/animal/felidae/cat.(*Cat).Pee
         0     0%   100%   3732.66s 99.20%  main.main
         0     0%   100%        30s   0.8%  net/http.(*ServeMux).ServeHTTP
         0     0%   100%        30s   0.8%  net/http.(*conn).serve
1
2
3
4
5
6
7
8
9
10
11
12
13
14
2
3
4
5
6
7
8
9
10
11
12
13
14
上次更新: 2024/3/18 16:59:48